网络自助新闻发稿平台,价格低,发稿快
@致力于文化传播给企业带来的价值
@致力于文化传播给企业带来的价值

时间: 2020-12-25 08:45:03 作者: 媒介星软文平台
一、内容说明
1.分析背景:近年来,电商发展势头迅猛,其经济发展规模日益扩大,依靠其强大的便利性,越来越多的消费者选择线上购物替代线下的消费。淘宝、京东、亚马逊等app作为电商发展的一个重要交易平台,在这其中有着巨大的优势。本文将通过部分用户交易的行为数据,来分析理解用户对于线上交易的相关需求,提高未来平台运营的竞争力。
2.数据来源:

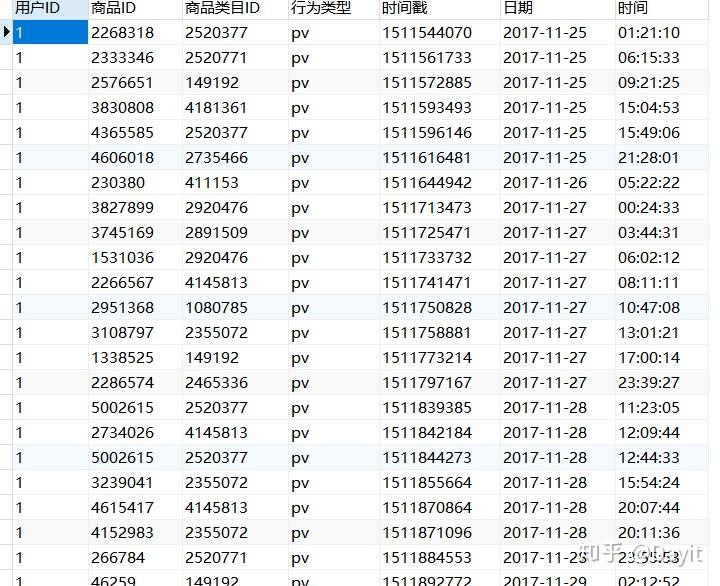
本数据集(UserBehavior.csv)包含了2017年11月25日至2017年12月3日之间,有行为的约一百万随机用户的所有行为(行为包括点击、购买、加购、喜欢)。由于数据量较大,此次数据只引用其中100000份数据源进行数据分析。
数据字段含义:
字符串类型,用户ID
字符串类型,商品ID
字符串类型,商品所属类目ID
字符串,枚举类型,包括('pv', 'buy', 'cart', 'fav')
整型,行为发生的时间戳
用户行为类型中,pv:商品详情页pv,等价于点击;buy:商品购买;cart:将商品加入购物车;fav:收藏商品。
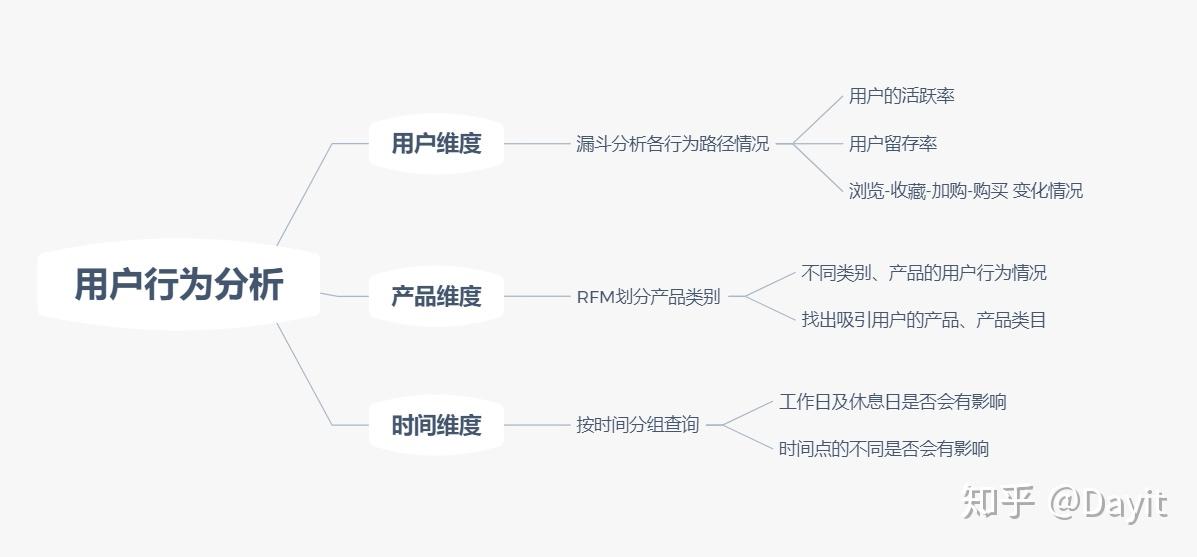
3.分析思路
通过用户维度、产品维度以及时间维度进行分析,结合漏斗分析、RFM分析等方法进行相关数据检验,为平台及商家日后发展提供一定的建议和帮助。
二、数据清洗
①、查找是否存在空值
select * from userbehavior
where 商品id is null or 用户id is null or 商品类目id is null or 行为类型 is null or 时间戳 is null
②、增加日期和时间作为辅助列
alter  table userbehavior add 日期 VARCHAR(255);
update userbehavior set 日期 = FROM_UNIXTIME(时间戳,'%Y-%m-%d')
alter  table userbehavior add 时间 VARCHAR(255);
update userbehavior set 时间 = FROM_UNIXTIME(时间戳,'%H:%i:%S')
③、剔除异常数据
select 日期,count(1) '计数' from userbehavior
group by 日期
order by 日期
delete from userbehavior
where 日期 > '2017-12-03'  or  日期 < '2017-11-25'
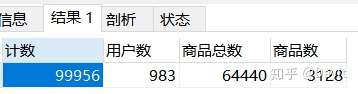
④、了解数据整体情况
select count(1) 计数 ,count(distinct 用户id) '用户数',count(distinct 商品id) '商品总数',count(distinct 商品类目id) '商品数'
from userbehavior
三、数据分析过程
1、用户行为情况分析
①、用户活跃率
PV:
select 日期,count(用户id) '活跃人数'
from userbehavior
group by 日期
UV:
select 日期,count(distinct 用户id) '活跃人数'
from userbehavior
group by 日期
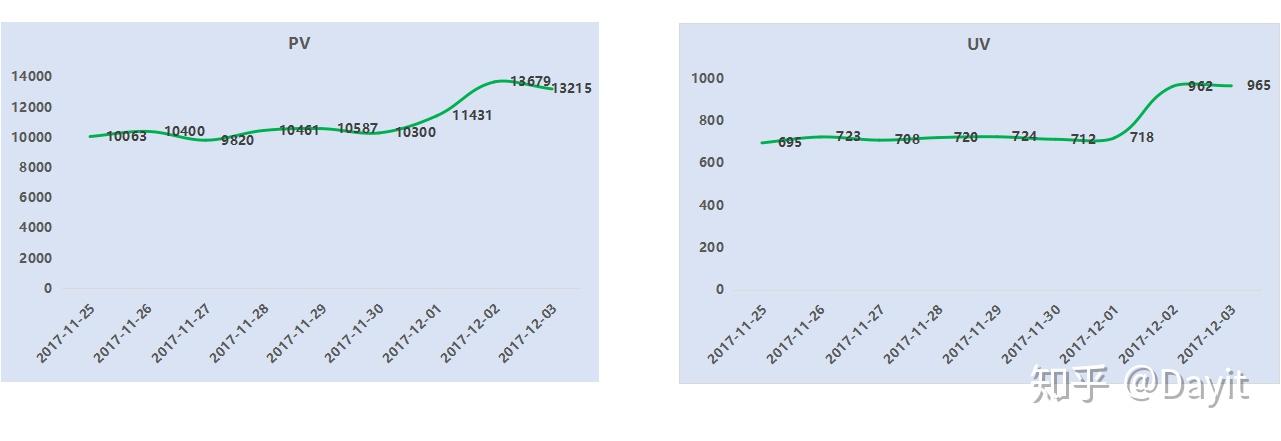
图中折线图可以发现,在12月2日到12月3日,明显的用户关注量比往常多,可以推断,这两天店铺在进行活动或者商品优惠力度很大,吸引了大量顾客进店浏览。
②、根据星期及每天时间分析用户活跃时间
select 日期,
case when WEEKDAY(日期) =0 then '星期一'
     when WEEKDAY(日期) =1 then '星期二'
   when WEEKDAY(日期) =2 then '星期三'
   when WEEKDAY(日期) =3 then '星期四'
   when WEEKDAY(日期) =4 then '星期五'
   when WEEKDAY(日期) =5 then '星期六'
   when WEEKDAY(日期) =6 then '星期日'
   else null end as 星期,行为类型,count(1) 计数
from userbehavior
group by 日期,
case when WEEKDAY(日期) =0 then '星期一'
     when WEEKDAY(日期) =1 then '星期二'
   when WEEKDAY(日期) =2 then '星期三'
   when WEEKDAY(日期) =3 then '星期四'
   when WEEKDAY(日期) =4 then '星期五'
   when WEEKDAY(日期) =5 then '星期六'
   when WEEKDAY(日期) =6 then '星期日'
   else null end ,行为类型
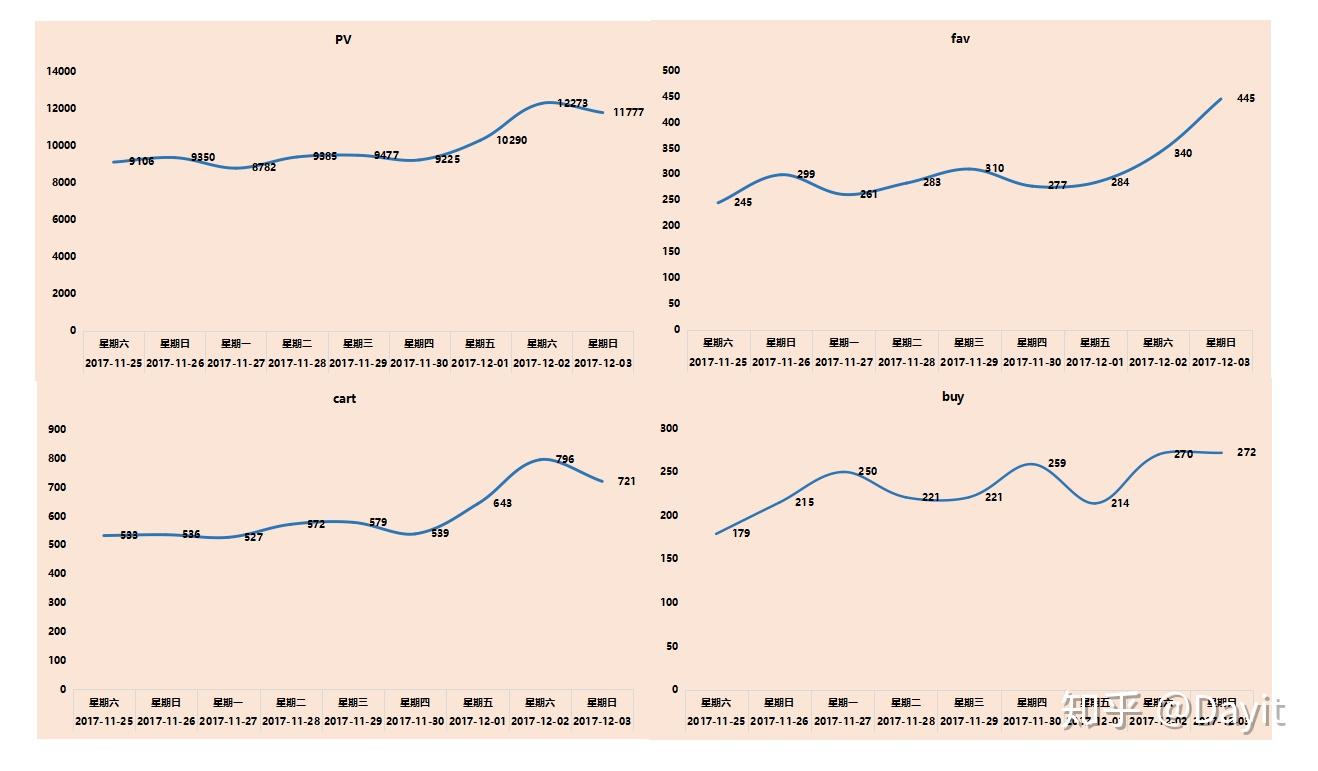
由图可以看出,周六周日对于PV、fav、cart、buy的影响不是特别大。明显可以看出12.2和12.3这两天用户的行为动作相较于前几天又很大的提高。
select SUBSTR(时间,1,2),行为类型,count(1)
from userbehavior
group by
SUBSTR(时间,1,2),行为类型
order by SUBSTR(时间,1,2)
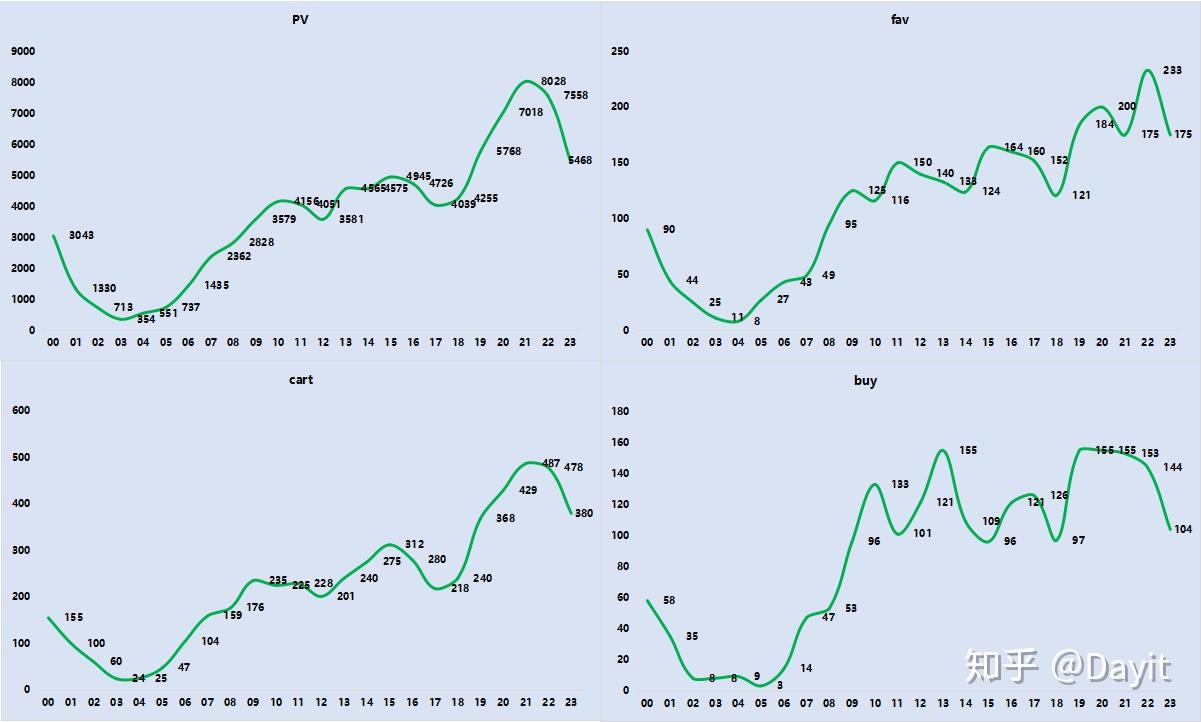
图中趋势可以发现,用户在每天的上午的10点之后及晚上的18点之后会有一波高峰期,这可能与淘宝的活动设定有关。
2、用户行为转化率
select count(1) '用户行为总数',
sum(case when 行为类型 = 'pv' then 1 else 0 end) as '点击',
sum(case when 行为类型 = 'cart' then 1 else 0 end) as '加购',
sum(case when 行为类型 = 'fav' then 1 else 0 end) as '收藏',
sum(case when 行为类型 = 'buy' then 1 else 0 end)as '购买',
concat(round(sum(case when 行为类型 = 'cart' then 1 else 0 end)/sum(case when 行为类型 = 'pv' then 1 else 0 end)*100,2),'%') as '点击-加购转化率',
concat(round(sum(case when 行为类型 = 'fav' then 1 else 0 end)/sum(case when 行为类型 = 'cart' then 1 else 0 end)*100,2),'%') as '加购-收藏转化率',
concat(round(sum(case when 行为类型 = 'buy' then 1 else 0 end)/sum(case when 行为类型 = 'fav' then 1 else 0 end)*100,2),'%') as '收藏-购买转化率',
concat(round(sum(case when 行为类型 = 'fav' then 1 else 0 end) /sum(case when 行为类型 = 'pv' then 1 else 0 end)*100,2),'%') as '点击-收藏转化率',
concat(round(sum(case when 行为类型 = 'buy' then 1 else 0 end) /sum(case when 行为类型 = 'pv' then 1 else 0 end)*100,2),'%') as '点击-购买转化率'
from userbehavior
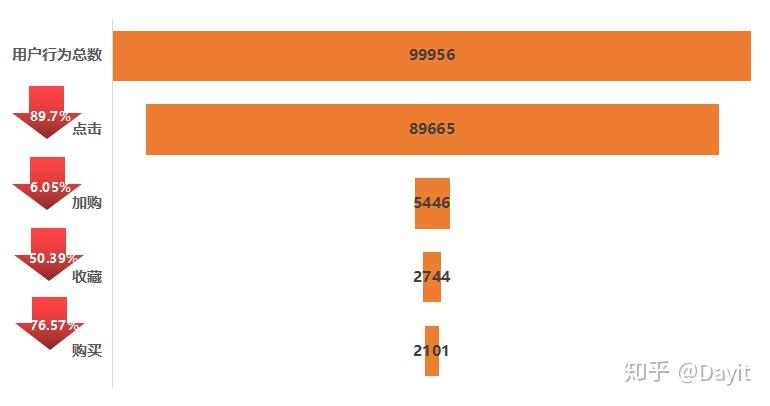
通过漏斗分析法可以发现,顾客通过点击到加购,再到收藏,最后产生的购买的数量的占比只有一部分,尤其在点击到加购部分,转化率仅为6.05%;
用于流失率较大,由此假设:
(1)、用户不加购的原因是否是产品的原因,对于用户吸引力高的产品但是用户购买少。商品种类不吸引客户。
(2)、是否加购或收藏用户的消费数量比不加购或者收藏的用户消费数量多,购买流程不同会影响转化率。
①、验证假设1
平台商品推送不符合用户需求
 select 商品类目id , 行为类型 , tt
 from (select *,ROW_NUMBER() over(partition by 行为类型  order by aa.tt desc ) as rk
 from
 (select `商品类目ID`,行为类型,count(1) as tt
 from userbehavior
 group by `商品类目ID`,行为类型
 order by count(1) desc ) aa ) cc
 where rk <= 10
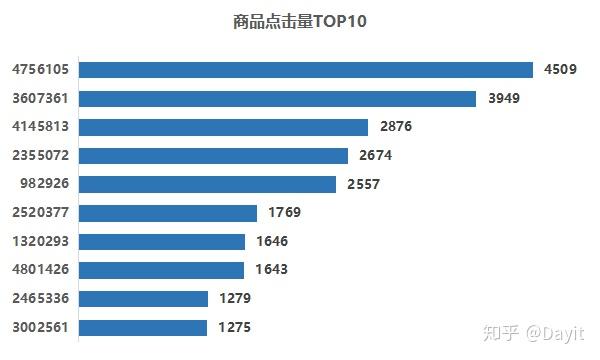
TOP5点击量商品ID:4756105、3607361、4145813、2355072、982926
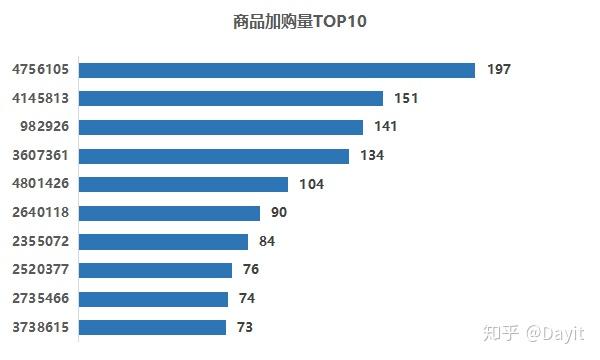
TOP5加购量商品ID:4756105、4145813、982926、3607361、4801426
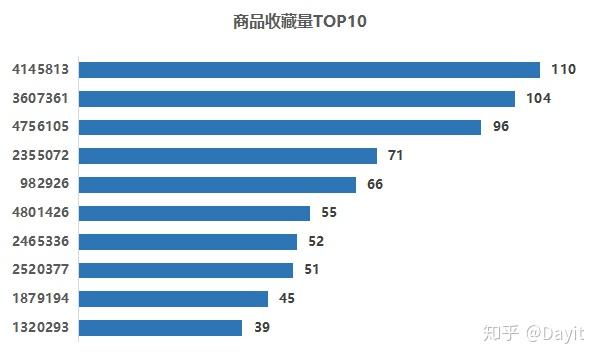
TOP5收藏量商品ID:4145813、3607361、4756105、2355072、982926
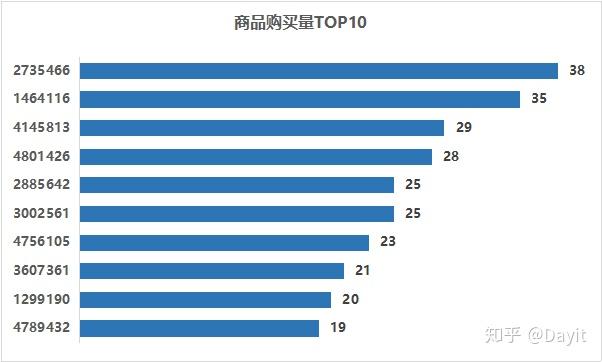
TOP5购买量商品ID:2735466、1464116、4145813、4801426、2885642
通过查询发现TOP10点击和购买的商品种类吻合度较低。各动作前10款商品中,仅有4款是都存在的,吻合度仅为40%。验证假设1成立,对于商品,平台考虑到用户喜爱的商品,有针对性的推出商品,满足用户需求。假设1成立。
②、验证假设2:
创建视图
create view behavior
as
select 用户ID,count(行为类型) as 用户行为数,
sum(case when 行为类型="pv"   then 1 else 0 end) as pv,
sum(case when 行为类型="fav"  then 1 else 0 end) as uv,
sum(case when 行为类型="cart" then 1 else 0 end) as cart,
sum(case when 行为类型="buy"  then 1 else 0 end) as buy
from userbehavior
group by 用户ID;
group by 用户ID
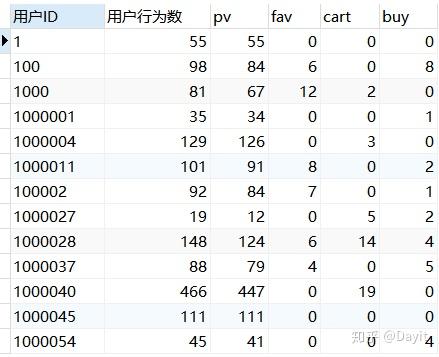
用户行为过程分析:
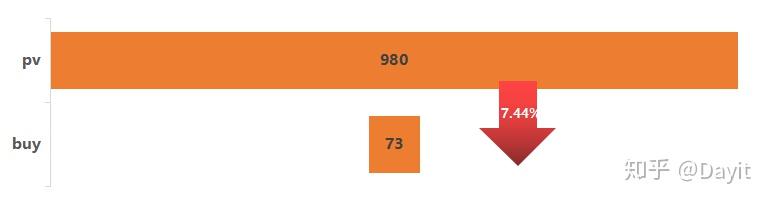
①、pv - buy
select count(用户ID) as 点击人数
from behavior
where pv > 0
select count(用户ID) as 购买人数
from behavior
where pv > 0 and buy > 0 and fav = 0 and cart = 0
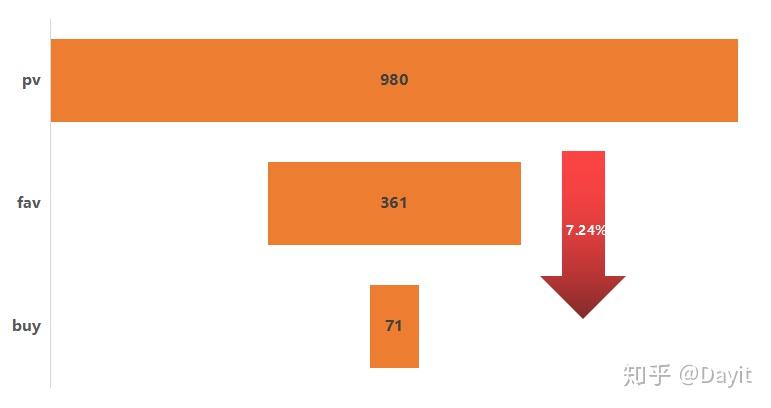
②、pv - fav - buy
select count(用户ID) as 点击后收藏人数
from behavior
where pv>0 and fav>0
select count(用户ID) as 点击、收藏后购买人数
from behavior
where pv>0 and fav>0 and cart=0 and buy>0
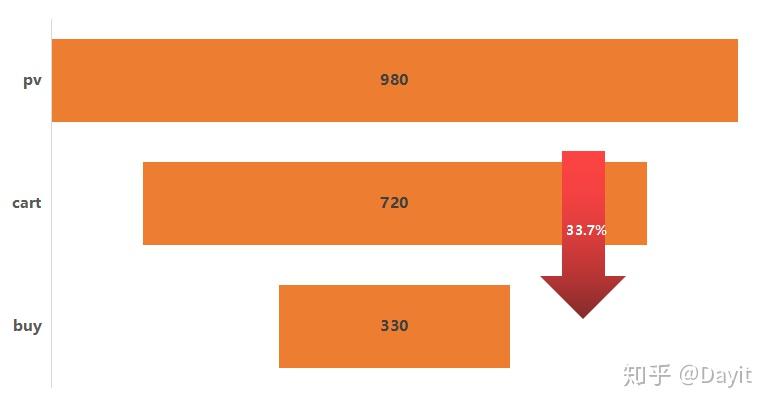
③、pv - cart - buy
select count(用户ID) as 点击后加购人数
from behavior
where pv>0 and cart>0
select count(用户ID) as 点击、加购后购买人数
from behavior
where pv>0 and fav=0 and cart>0 and buy>0
④、pv - fav、cart - buy
select count(用户ID) as 点击、收藏并加购人数
from behavior
where pv>0 and fav>0 and cart>0
select count(用户ID) as 点击、收藏并加购后购买人数
from behavior
where pv>0 and fav>0 and cart>0 and buy>0
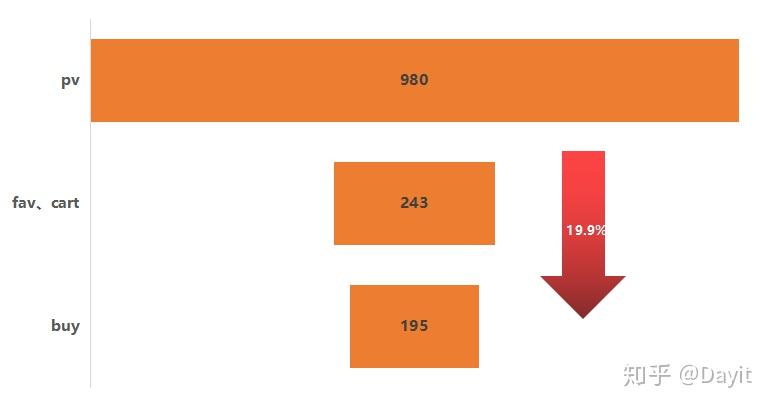
由图中数据可知,所有用户在进行点击、收藏、加购、购买这些动作中。其中加购后购买的用户占所有点击用户比例最高,其次是收藏加购的用户,再是收藏的用户,最后是点击后直接进行购买的用户占比最低。由此可以得出,用户对于自己点击过后的商品,通过收藏或者加购后,能够更方便的找到自己心仪的产品,同时这些加购或者收藏的商品也是顾客一定程度上认可的商品。假设2成立。
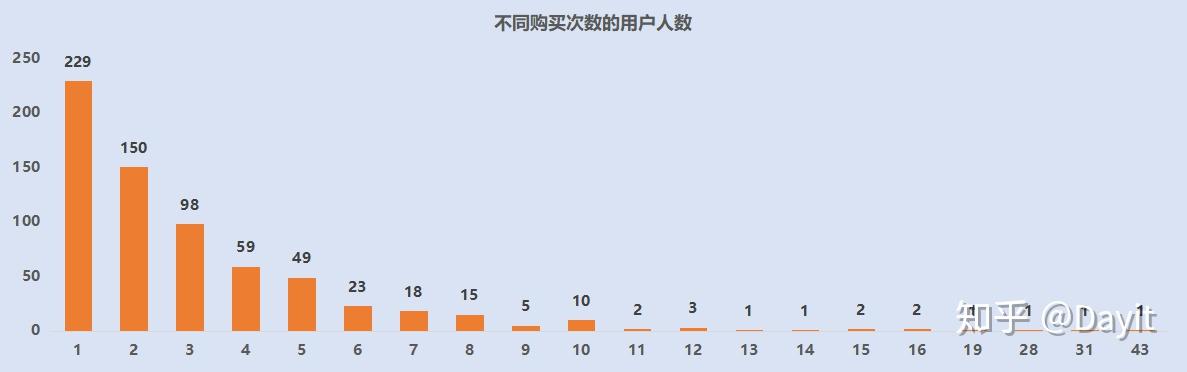
3、用户复购率:
分析复购人群数量:
select 购买次数, count(distinct 用户id) as'人数'
from(
select `用户ID`,count(用户ID) as '购买次数'
from UserBehavior
where 行为类型 = 'buy'
group by 用户ID) as a
group by 购买次数
分析用户周期内再次购买的占比情况:
select   cc.minday '日期',
sum(case when cha = 0 then 1 else 0 end) as 当天,
concat(round(sum(case when cha = 1 then 1 else 0 end)/sum(case when cha = 0 then 1 else 0 end)*100,2),'%') as 第一天,
concat(round(sum(case when cha = 2 then 1 else 0 end)/sum(case when cha = 0 then 1 else 0 end)*100,2),'%')  as 第二天,
concat(round(sum(case when cha = 3 then 1 else 0 end)/sum(case when cha = 0 then 1 else 0 end)*100,2),'%')  as 第三天,
concat(round(sum(case when cha = 4 then 1 else 0 end) /sum(case when cha = 0 then 1 else 0 end)*100,2),'%') as 第四天,
concat(round(sum(case when cha = 5 then 1 else 0 end)/sum(case when cha = 0 then 1 else 0 end)*100,2),'%')  as 第五天,
concat(round(sum(case when cha = 6 then 1 else 0 end) /sum(case when cha = 0 then 1 else 0 end)*100,2),'%') as 第六天,
concat(round(sum(case when cha = 7 then 1 else 0 end) /sum(case when cha = 0 then 1 else 0 end)*100,2),'%') as 第七天,
concat(round(sum(case when cha = 8 then 1 else 0 end) /sum(case when cha = 0 then 1 else 0 end)*100,2),'%') as 第八天
from
(
select aa.`用户id`,日期,minday,DATEDIFF(日期,bb.minday) as cha from
(select distinct 用户id,日期
from userbehavior
where 行为类型 = 'buy')aa
left join
(select 用户id, min(日期) as minday
from userbehavior
where 行为类型 = 'buy'
group by 用户id) bb on aa.`用户id` =bb.`用户id`)cc
group by cc.minday
order by cc.minday
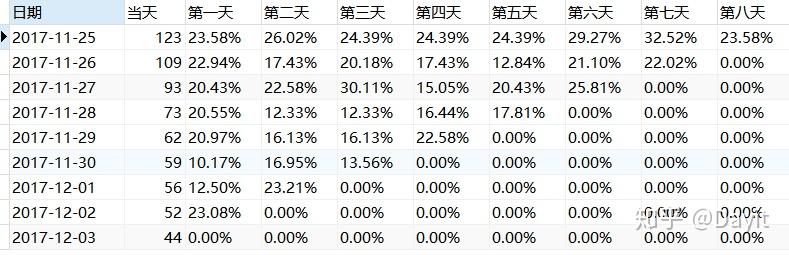
从复购人群数量以及复购占比可以发现,用户的二次及以上复购率为65.8%,复购率较高,并且用户在当天购买后,之后再次进行购买的复购率大部分在15%以上,用户忠诚度较高。对此,平台可以依次对于忠诚度高的用户进行重点维护,保留住老客户,拉动新客户消费。
4、用户留存率:
分析相似用户群里随时间变化情况
计算周期内用户在一段时间之后再次出现的次数占比
select   cc.minday '日期',
sum(case when cha = 0 then 1 else 0 end) as 当天,
concat(round(sum(case when cha = 1 then 1 else 0 end)/sum(case when cha = 0 then 1 else 0 end)*100,2),'%') as 第一天,
concat(round(sum(case when cha = 2 then 1 else 0 end)/sum(case when cha = 0 then 1 else 0 end)*100,2),'%')  as 第二天,
concat(round(sum(case when cha = 3 then 1 else 0 end)/sum(case when cha = 0 then 1 else 0 end)*100,2),'%')  as 第三天,
concat(round(sum(case when cha = 4 then 1 else 0 end) /sum(case when cha = 0 then 1 else 0 end)*100,2),'%') as 第四天,
concat(round(sum(case when cha = 5 then 1 else 0 end)/sum(case when cha = 0 then 1 else 0 end)*100,2),'%')  as 第五天,
concat(round(sum(case when cha = 6 then 1 else 0 end) /sum(case when cha = 0 then 1 else 0 end)*100,2),'%') as 第六天,
concat(round(sum(case when cha = 7 then 1 else 0 end) /sum(case when cha = 0 then 1 else 0 end)*100,2),'%') as 第七天,
concat(round(sum(case when cha = 8 then 1 else 0 end) /sum(case when cha = 0 then 1 else 0 end)*100,2),'%') as 第八天
from
(
select aa.`用户id`,日期,minday,DATEDIFF(日期,bb.minday) as cha from
(select distinct 用户id,日期
from userbehavior)aa
left join
(select 用户id, min(日期) as minday
from userbehavior
group by 用户id) bb on aa.`用户id` =bb.`用户id`)cc
group by cc.minday
order by cc.minday
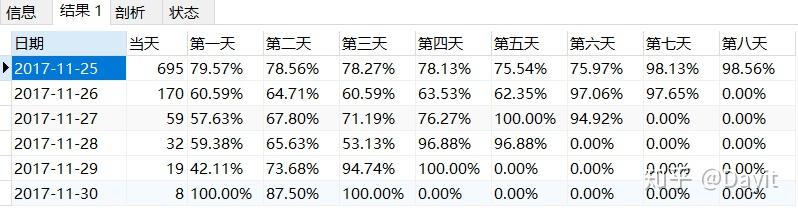
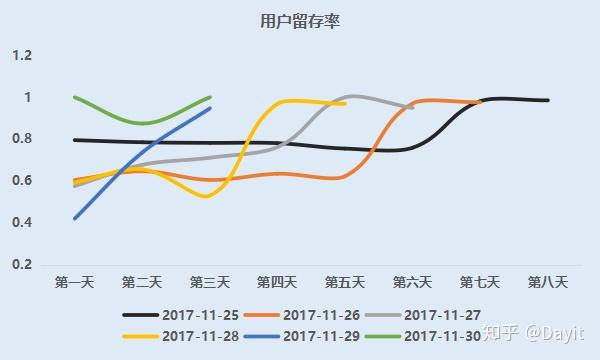
从图中数据可以看出,用户的留存率基本都在60%到90%之间,其中从12月以来未产生新的用户,说明没有拉新的动作活动。但是在12月2号和12月3号期间,老用户的活跃率明显提升,这应该是由于促销活动的举行导致的。
5、用户价值分析:
通过客户分类,对客户群体进行细分,区别出低价值客户、高价值客户,对不同的客户群体开展不同的个性化服务,将有限的资源合理地分配给不同价值的客户,实现效益最大化。
R:recency 最近1次消费的时间间隔
F:frequency 消费频率(一段时间内消费了几次)
M:monetary 消费金额(一段时间内消费的金额)
计算R、F值,并对用户进行打分
select 用户id,R,
case when R = 0 then 5
     when R between 1 and 2 then 4
		 when R between 3 and 4 then 3
		 when R between 5 and 6 then 2
 else 1 end as R_score ,F,
 case when F > 25 then 5
      when F between 17 and 25 then 4
		  when F between 11 and 16 then 3
		  when F between 5 and 10 then 2
 else 1 end as F_score
 from (
select `用户ID`,DATEDIFF('2017-12-03',max(日期)) R,count(1) F
from userbehavior
where  行为类型 = 'buy'
group by 用户id)aa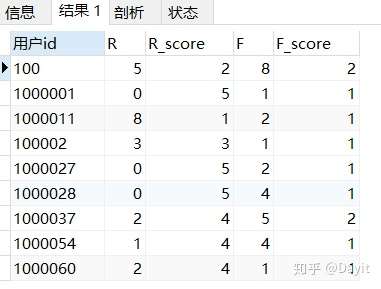
计算出R、F的最大最小值,划分R、F的衡量标准
select max(R),min(R),max(F),min(F)
from (
select `用户ID`,DATEDIFF('2017-12-03',max(日期)) R,count(1) F
from userbehavior
where  行为类型 = 'buy'
group by 用户id)aa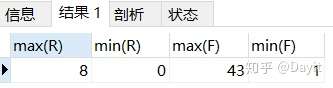
select avg(R_score),avg(F_score) from (
select 用户id,R,
case when R = 0 then 5
     when R between 1 and 2 then 4
		 when R between 3 and 4 then 3
		 when R between 5 and 6 then 2
			else 1 end as R_score ,F,
 case when F > 25 then 5
      when F between 17 and 25 then 4
		  when F between 11 and 16 then 3
		  when F between 5 and 10 then 2
 else 1 end as F_score
 from (
select `用户ID`,DATEDIFF('2017-12-03',max(日期)) R,count(1) F
from userbehavior
where  行为类型 = 'buy'
group by 用户id)aa) bb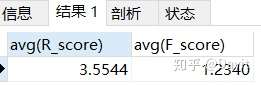
计算用户分类后各个分类的用户数量
select
(case when R_score > 3.5544 and F_score > 1.234 then '重要价值客户'
     when R_score > 3.5544 and F_score < 1.234 then '重要发展客户'
     when R_score < 3.5544 and F_score > 1.234 then '重要保持客户'
     when R_score < 3.5544 and F_score < 1.234 then '重要挽留客户'
else 0 end ) as 用户分类,count(1) 计数
from (
select 用户id,R,
case when R = 0 then 5
     when R between 1 and 2 then 4
		 when R between 3 and 4 then 3
		 when R between 5 and 6 then 2
 else 1 end as R_score ,F,
 case when F > 25 then 5
      when F between 17 and 25 then 4
		  when F between 11 and 16 then 3
		  when F between 5 and 10 then 2
 else 1 end as F_score
 from (
select `用户ID`,DATEDIFF('2017-12-03',max(日期)) R,count(1) F
from userbehavior
where  行为类型 = 'buy'
group by 用户id)aa )bb
group by
(case when R_score > 3.5544 and F_score > 1.234 then '重要价值客户'
     when R_score > 3.5544 and F_score < 1.234 then '重要发展客户'
     when R_score < 3.5544 and F_score > 1.234 then '重要保持客户'
     when R_score < 3.5544 and F_score < 1.234 then '重要挽留客户'
else 0 end )
从图中可以发现,用户主要集中在重要发展客户和重要挽留客户。针对不同的客户,要有不同的应对策略。
四、结论及建议
1、对于淘宝的促销活动或者商品的优惠活动,商家要大大抓住这种机会去促进商品的销售,获得更多的用户青睐。
2、掌握消费者的消费时间点,例如每天上午的10点之后以及晚上的18点之后,消费者的访问情况明显上升,可以此利用营销活动加大推广力度。
3、商品在pv、fav、cart、buy中TOP10的商品吻合度不高,对此。商家要了解清楚消费者的习性,完善商品推送功能,精准匹配消费者与商品,同时,精简商品类目,优化选择,提供更多服务。提高商品的吻合度。同时,对于已经吻合的商品,要继续保持。
4、用户在pv、fav、cart、buy这几个流程当中。明显用户加购后的购买率会更高。依次,商品可以推出提高用户加购动作的营销活动,例如搭赠优惠券,加购抽奖等活动,提高加购率。
5、用户对于平台的粘性还是很强的,对此。要多推出活动,维稳老客户的同时,拉动新客户消费。提高用户在平台的留存率。
6、针对不同分类的用户,要采取不同的方式。对于30位重要保持客户,要倾斜更多资源,提供VIP服务;对于285位重要发展客户,要提供有用资源唤回他们;对于251位重要挽留客户,要提供会员计划,推荐其他产品;对于105位重要价值客户,要重点拜访,提高留存率。
扫一扫,添加好友!

免责声明:本文系转载,版权归原作者所有;旨在传递信息,不代表本站的观点和立场和对其真实性负责,如因作品内容,版权和其他问题需要同本网站联系的,请邮件联系2290/781984@qq.com

海量网站直线发稿、24小时自助发稿平台、助您提升营销效率!
 综合咨询
综合咨询 销售咨询
销售咨询